Your buyers ask AI who to pick. Make sure it’s you.
Gets you selected acrossChatGPTClaudeGeminiPerplexity
RocMode shows you whether AI picks you or your rival, finds the work that changes it, builds that work, and sends it to you to approve. Then it proves what moved.
We ask ChatGPT, Claude, Gemini and Perplexity the questions your buyers ask, and show where they pick you and who they pick instead. Free, no login. What’s the Score? Or sign up free and try everything for 14 days.
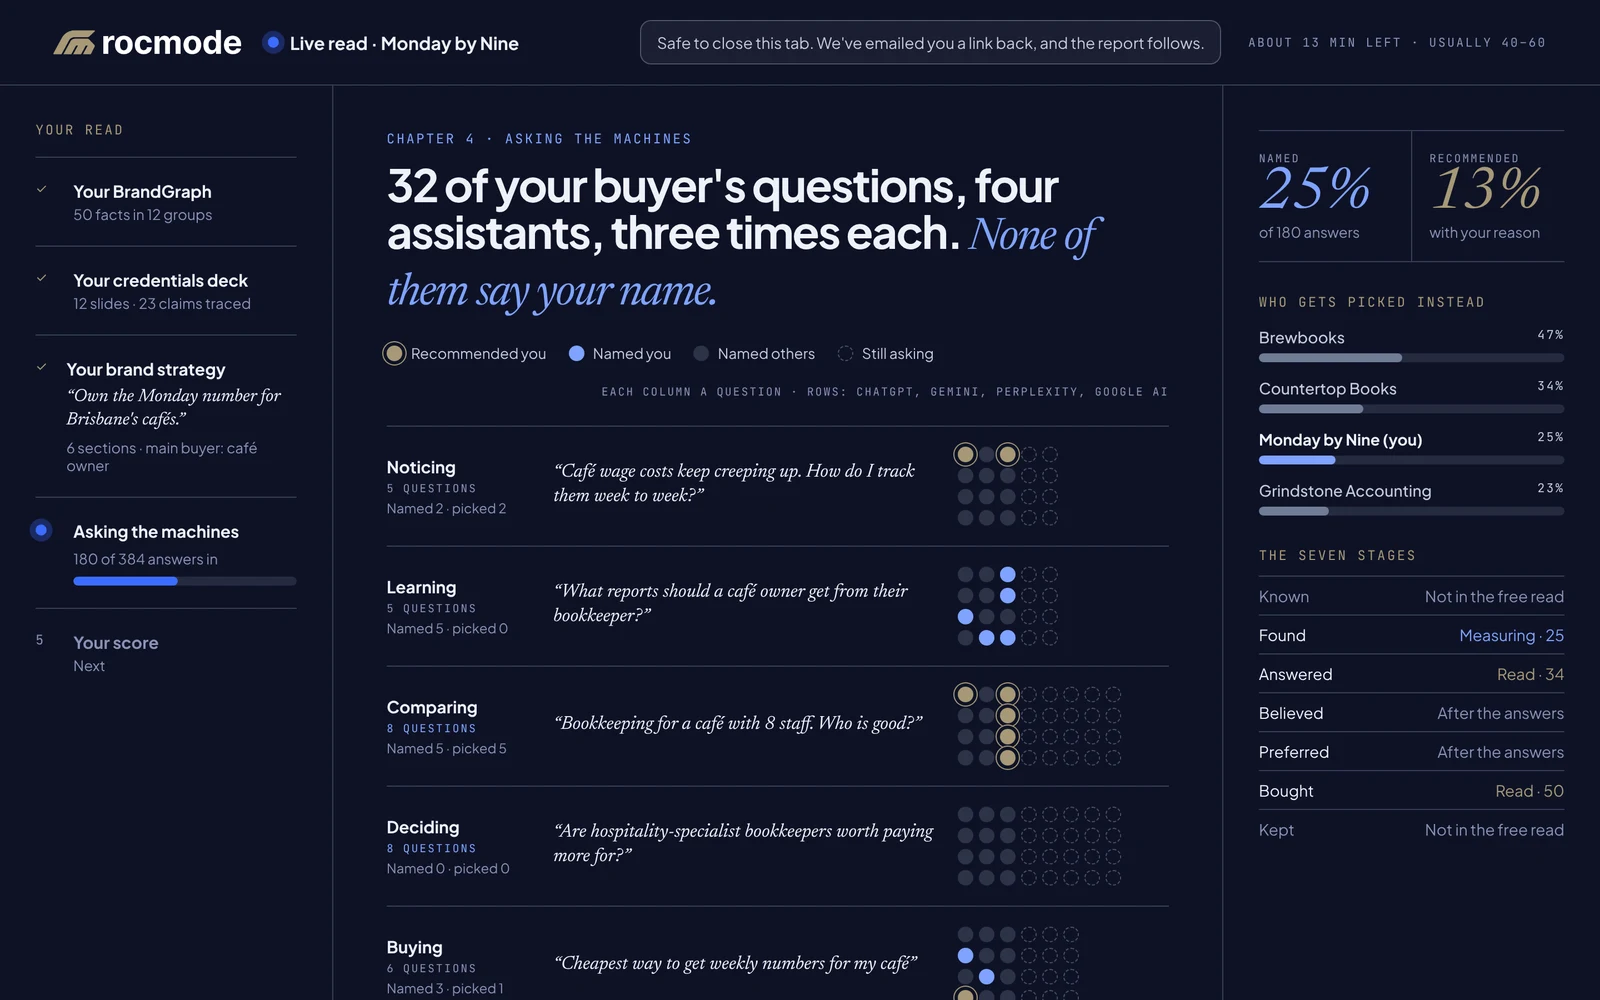
RocMode · Live read · Monday by Nine (example)
Asking ChatGPTBefore
The AI marketing and sales platform
Marketing and sales, rebuilt for the age of AI.
Your website in. A whole marketing and sales team’s work out. RocMode learns your brand from your site, then does the work: strategy, website, ads, social, PR, partners, email, design, and the deck that wins the deal. You approve every piece.
Other tools do one job. This does all of them, as one story.
Other AI guesses. This works from your facts and proof.
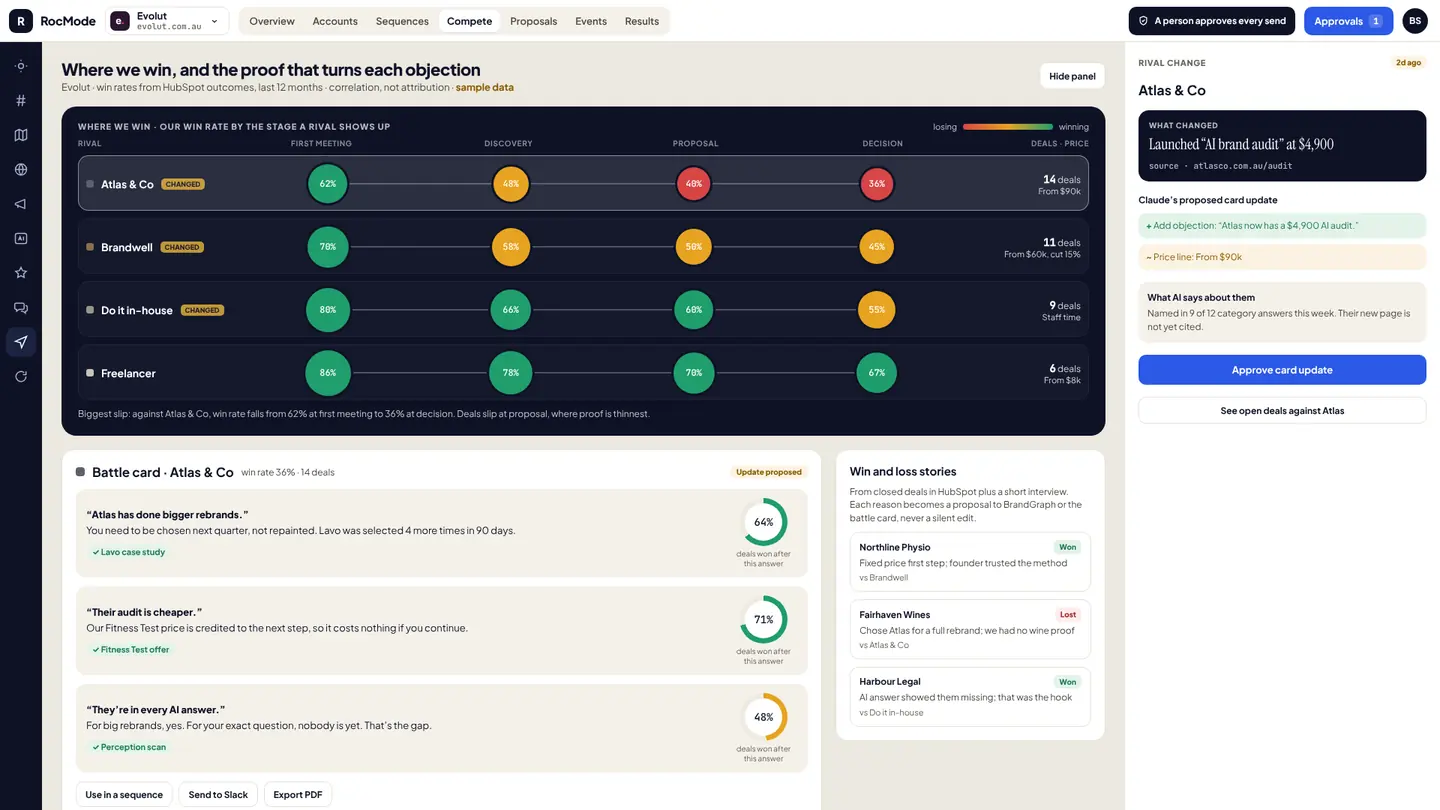
Other tools stop at the post. This follows it to the signed deal, and learns what won.
How it works
KnowWhere you really standActWhat to fix firstCreateWe build the work. You approve itProveDid it move?
Know · Step 1 of 10
It gets you. It gets your customers. It connects the dots.
Everything about your brand, your buyers and your rivals, sorted and connected.
Then it works out what to say, where, when and why. It’s the brain behind every step.
Builds: Customers · Offerings · Rivals · Proof
RocMode · BrandGraph · sample data
Following one momentCISO · Comparing · “Who’s the best managed security provider for a hospital group?”Moment found
Brand core3 found
Voice3 found
Visual identity3 found
Products and services3 found
Pricing3 found
Personas and markets3 found
Pains, gains, jobs3 found
Journeys and objections3 found
Proof and trust3 found
Content3 found
Competitors and partners3 found
Team2 found
Halvard Security35 facts
Two hospital case studies/partners
FactClaimProofAI-suggestedExample: Halvard Security, an invented managed security provider.
Reading halvardsecurity.com.au, socials, reviews and listings…
Halvard SecurityBrandGraph
12areas, all connected
3personas
15moments
6rivals
Sample data
Your customers
Customers
›
Personas
›
Journeys
›
Pains, jobs, objections
›
Moments
What you sell
Products and services
›
Offerings
›
Value proposition
›
Differentiation
Your rivals
Competitors
›
Industry
›
Expectations
›
Gaps to exploit
Moments + offerings
Opportunities
›
Campaigns
›
Ads
›
Sales
Content gaps
›
Content
›
Website
So it knows
What to say.Where. When. Why.
Moment foundCISO · Comparing · “Who’s the best managed security provider for a hospital group?”
Know · Step 2 of 10
Your strategy, from everything it knows.
Positioning built from your offerings and the gaps your rivals leave.
Claims you can’t back get cut before anyone sees them.
Seen isn’t selected. AI picks the brands it can tell apart.
Every era of marketing had its visibility number, and AI mentions are just the newest. Most AI tools still sell you visibility. But being mentioned isn’t being chosen, and for the first time you can measure the pick itself.
BroadcastAwareness
Media buyingReach
SearchRankings
SocialFollowers
AIMentions
What countsSelected
What AI made cheap
Making things.
Posts, pages, ads and reports in minutes
Anyone with a login can do it
Your competitors have the same tools
Sell on volume and you compete on price.
What AI made measurable
Being chosen.
Brand ABrand BYouBrand CBrand D
Buyers ask AI who to pick, and it names a few brands
You can ask the same questions and see who’s named
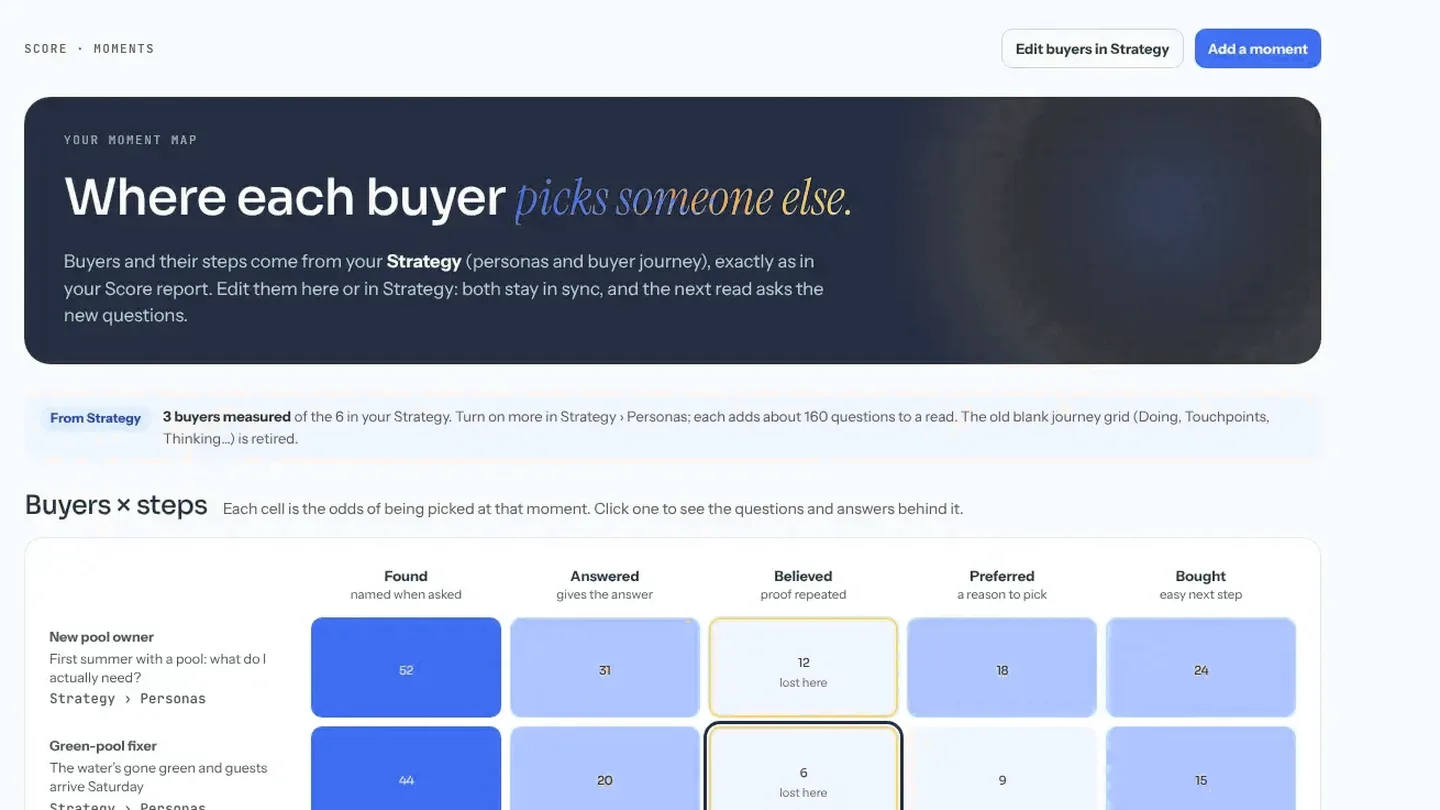
So you can see, moment by moment, where you win and lose
Compete on this and you compete on results.
See it on your brand
See how often AI picks you. Free.
We ask the AI assistants your buyers use the questions they really ask, many times each, at every step of their journey. Then we show where you’re picked, where you’re passed over, and who wins instead.
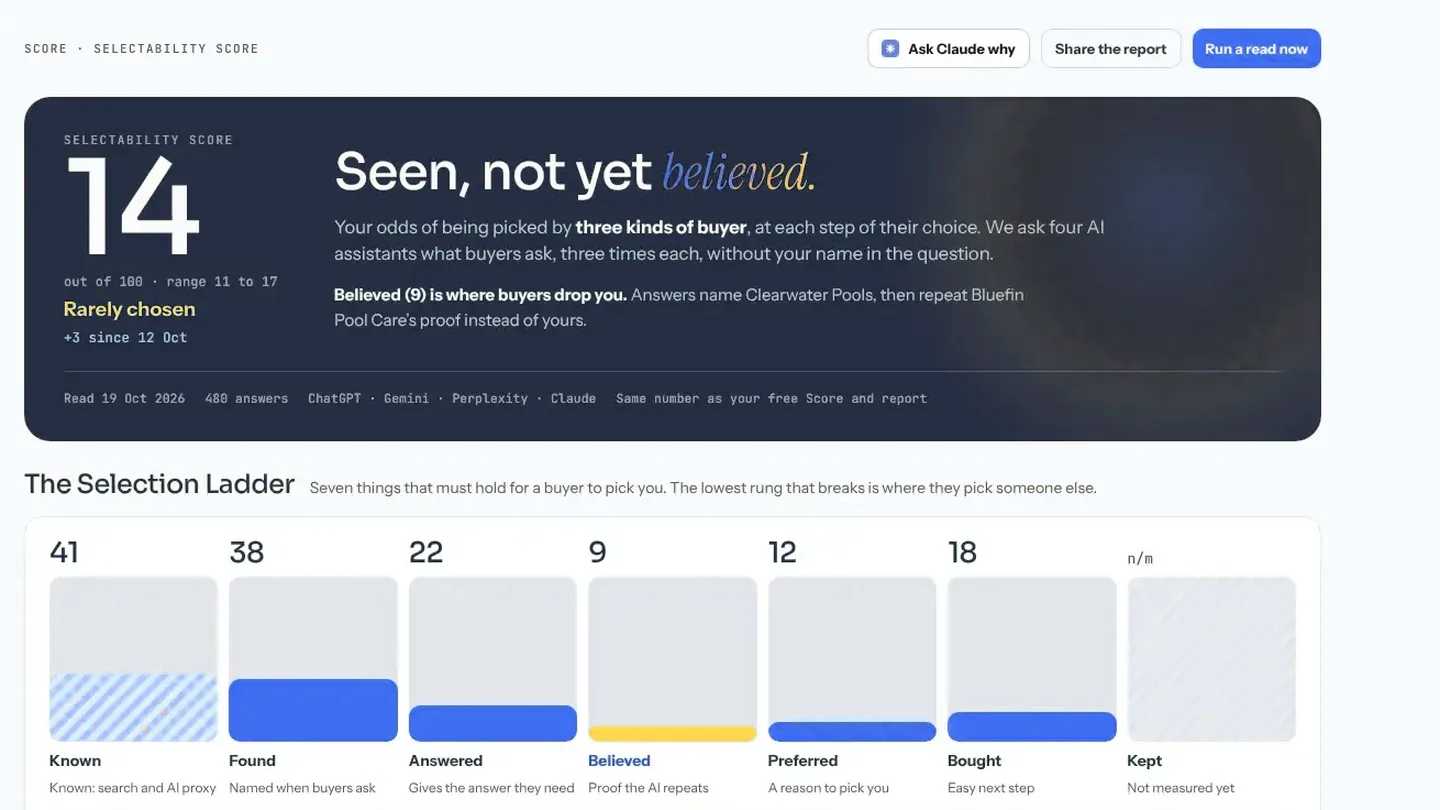
Your free Selectability Score asks the AI assistants the questions your buyers ask, without your name in them. You see who gets picked, at which moment, and the three gaps to fix first.
A score is only worth taking if it changes what you do next. The Loop is where it does.
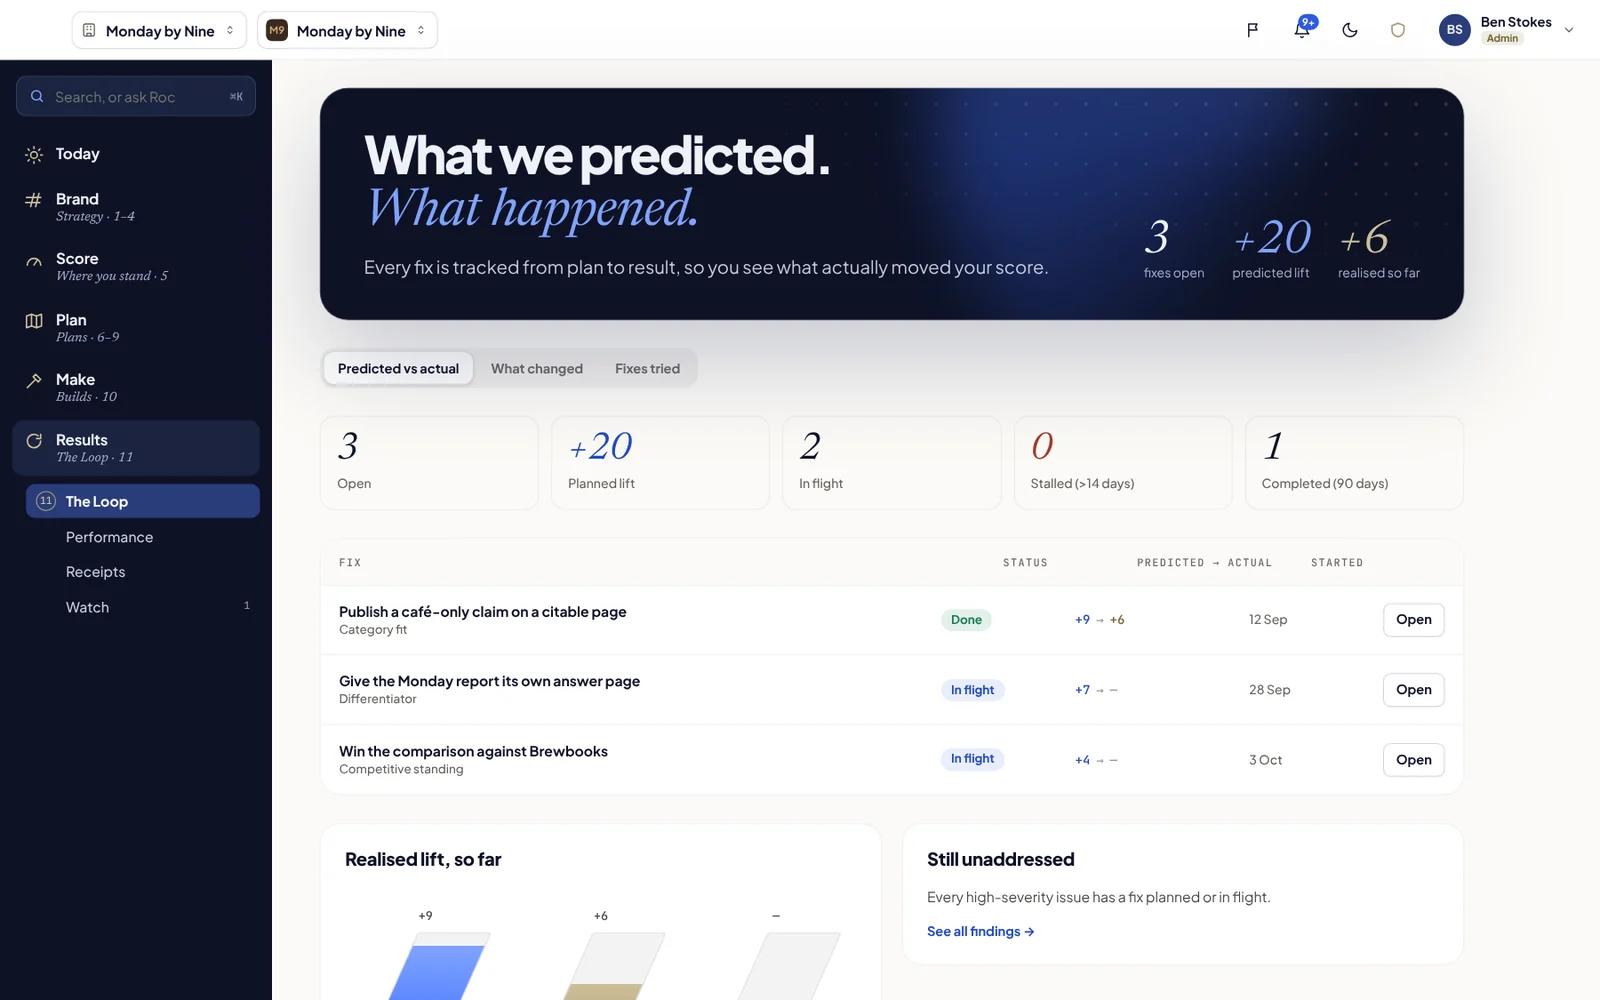
Every step so far has made a plan: the moments to win, the builds that lead them, the campaigns that bundle them. The Loop asks whether any of it worked, and changes the plan when it didn't. It answers one question: what changed, and what do we change?
The book sets out the whole method as six steps: measure, diagnose, write down the truth, prove it, publish it, measure again. Steps 1 to 10 of the Brand Journey are the middle four, done properly. This step is the first and the last: measuring, the same way every time, and recording what moved against what you expected to move.
Most teams run the first step and stop. Or they jump from a disappointing number straight to making more content. The Loop exists to stop both. It ties every fix to a prediction, and every prediction to a result, so the next quarter's plan is built on what actually happened.
In RocMode: what was predicted and what happened. Sample data.
What it reads from the chain
The Loop reads everything, and is the only step allowed to send changes back up the chain.
From
It takes
What it can send back
The map and the Score (step 5)
The baseline: every moment's score, its range, and where it's lost
A new moment; a moment split or merged; a question reworded (which starts a new baseline)
GTM strategy (step 6)
Which moments to win first, next, or hold
A moment moved between tiers, with the evidence
Credentials (step 2)
Every claim and its proof
A claim that buyers or assistants keep getting wrong, to be fixed at the source
The fourteen builds
Each build's "Loop for this build" table and first-year targets
A job dropped, added or reshaped
The Campaign Engine (step 10)
Every campaign brief, with its measures filled in
A campaign repeated, reshaped or dropped
The deal record
Fit calls, proposals, wins and losses, and why
The mode weights and the moment weights, checked against real sales
New clients
What was happening when they first thought of calling, and where they'd heard of Kestrel
The moments buyers actually name
Three clocks: monthly, quarterly, yearly
Clock
What happens
Who
How long
Monthly
The machine scan: the same 101 questions, the same six assistants, three runs each. Corrections where an assistant misquotes a fact. New clients' answers logged
Being named's owner
Half a day to read
Quarterly
The review: the full rescore (machines, people and places, the deal record); each build's Loop table; each campaign's measures; the levers re-ranked; the next quarter's top three fixes chosen and predicted
The Score's owner, with every build owner
Half a day, prepared over a week
Yearly
The map refreshed: moments added, split or retired; the question set reviewed (a new baseline if it changes); weights checked against the deal record; the next year's campaign calendar
The Score's owner and the managing partner
Two days
The book draws the quarter as four boxes in a circle: ask (week 1: re-run the same questions), fix (weeks 2 to 11: ship the top three fixes), ask again (week 12: the same sample, unchanged), and record (predicted against measured; drop what did nothing). Record is the step most teams skip, and the one this step exists for.
Step 1: measure again, unchanged
Run the same three instruments as the baseline in step 5, the same way.
Instrument
Moments
What's asked
Unchanged means
Asked of machines
61
101 questions, six assistants, three runs each: 1,818 answers
The same questions, word for word; the same assistants; the same number of runs
The same searches and places, checked the same way
Inside a deal
50
Read from the deal record: fit calls, proposals, wins and losses, and what buyers said
The same moments, read from the same fields
Three rules keep the comparison fair:
Change nothing in the sample mid-year. A reworded question, a new assistant or a new place starts a new baseline. Make those changes once a year, record them, and rescore the old quarter on the new set if you can.
Read ranges, not just numbers. Kestrel's baseline is 18, with a range of 12 to 27. A quarter that reads 21 hasn't proved anything on its own. A quarter whose range sits wholly above the old score of 18 is starting to.
Read moments, not just the total. The total moves slowly, because most of Kestrel's moments are out in the market and change only when the market notices. Individual moments move faster, and say which fix worked.
Step 2: diagnose, and rank the levers
For every moment that moved, or didn't, find the stage where it's lost and why. Then split the total loss, as step 5 did, and see whether its shape has changed.
At Kestrel's baseline, the Score lost 82 points, and three quarters of them at the gates:
Stage
Points lost at baseline
What it meant
Found
46
Buyers and assistants who never come across Kestrel at their moment
Known
16
Choosers who've never heard of it
Believed
5.8
Claims with no outside voice
Answered
5.1
Questions no page answers
Preferred
5.0
No reason a buyer could repeat
Bought
3.4
Price "on application"; a contact form as the next step
The levers come from that split: each fix names its moments and stages, and its predicted lift is worked out by rerunning the Score with the fix in place. At the baseline:
Fix
Predicted lift (range)
Website: the pages that answer the trigger, framing and options moments
+4.2 (2 to 6)
The finance director's business case kit
+1.5
The proposal: price, scope and the way out, side by side
+0.9
References within a week
+0.9
Procurement's pack
+0.3
All five together
to about 26 (22 to 28)
Each quarter, the levers are re-ranked from the new loss split. A fix that's landed drops off the list; the gap it closed shifts the shares, and the next biggest lever moves up.
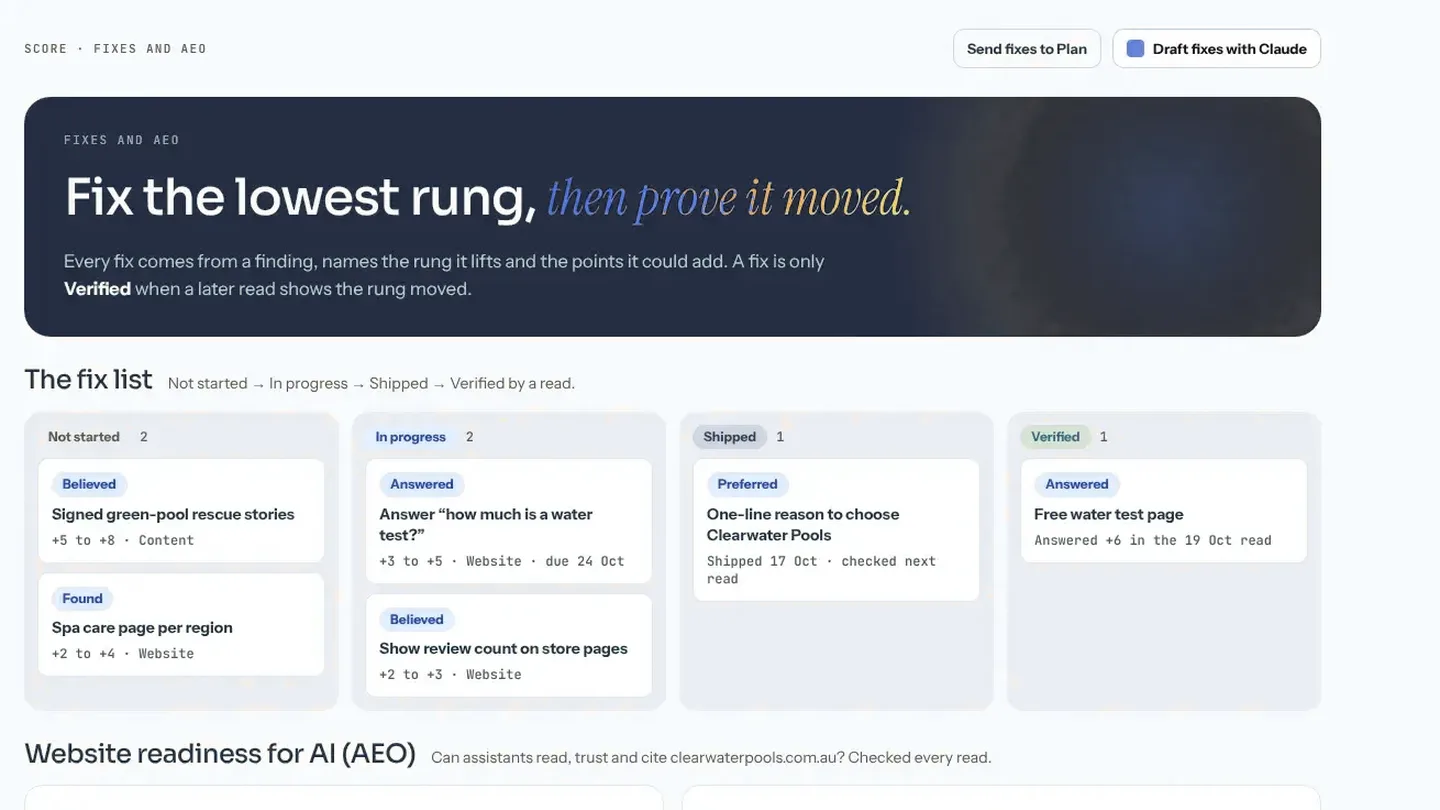
Step 3: predict, fix, record
Pick the top three fixes for the quarter, no more. For each, write down before you start:
The moments it should move, by name.
The stage it should move them at.
The predicted lift, as a range, from rerunning the Score with the fix in place.
When the effect should show: this quarter's rescore, or later (being named takes a scan or two; Known can take a year).
The build that owns it, and the date it ships.
At the end of the quarter, put the measured result beside the prediction. Four things can happen:
Measured against predicted
What it usually means
What to do
Within or above the range
The fix worked, and the model of why was right
Keep it; look for the same pattern in other moments
Below the range, but moving
Partly right, or too early
Keep it; check again next quarter before adding to it
Nothing moved
Wrong diagnosis, or it never shipped as planned
Check it shipped. If it did, drop it and re-diagnose
Something else moved instead
A side effect, or a campaign, a launch or the market
Note what else changed that quarter before crediting anything
The record is the asset. After a year, Kestrel knows which kinds of fix move which kinds of moment in its own market: something no benchmark or book can tell it. A fix that did nothing is dropped and recorded, not quietly continued.
Step 4: feed the map
The map in step 5 was the best guess at the time. The builds and campaigns test it every week, and they find things it missed. The Loop is where those findings go back in.
Where the finding comes from
What it looks like
What the map does
New clients' answers
Buyers keep naming a situation the map doesn't have
A new moment, as a hypothesis, until interviews confirm it
Outbound replies and fit calls
Owners keep asking the same question at the trigger
A new question for an existing moment, or a new moment
The scan
Assistants answer a question with a rival the map didn't list
The rival added to the alternatives; the moment's question checked
Campaigns
A campaign needed a page the sitemap didn't have (the Website rule)
The moment it found added to the map, or the page given an end date
The deal record
Moments that never appear in won deals, however well they score
Weights checked; the moment may matter less than assumed
GTM
A "hold" moment confirmed by interviews
Moved to "win next", with a build to lead it
Every change is logged with its source and its date, and the GTM strategy re-reads the map. A new moment means a new cell, a lead build and, at the next yearly reset, new questions in the sample.
The finished example: Kestrel's third-quarter review, in full
The review note the managing partner circulated at the end of September in Kestrel's first year, after the half-day review with every build owner. The firm, its clients and every figure are invented.
Kestrel Advisory: the Loop, Q3 review
1. The Score
Baseline (January)
End Q1
End Q2
End Q3
Score
18 (12 to 27)
19 (13 to 27)
21 (15 to 28)
24 (19 to 30)
Points lost at Found
46
44
41
38
Points lost at Known
16
16
16
16
The range now sits wholly above the January score of 18, for the first time. Known hasn't moved, as expected: it's read again at the year end, and most of the work that moves it (ads, social, outbound) only started in July.
2. This quarter's three fixes, predicted against measured
Fix
Owner
Moments
Predicted
Measured
Verdict
Website wave 2: options and comparing pages, by sector
Website
COO options; comparing, by sector
+2.0 (1 to 3)
+1.6
Within the range. Keep the pattern: answer in the first lines
The finance director's business case kit
The pitch
Finance director building the case
+1.5 (0.8 to 2.2)
+0.4
Below. The board paper section shipped on 24 September, too late for this rescore. Re-measure in Q4
The proposal: price, scope and the way out, side by side
The pitch
Finance director comparing; owner buying
+0.9 (0.4 to 1.4)
+1.1
Within. Keep
3. Moments worth noting
COO · options · flat output: 0 to 6. Assistants now name Kestrel in 2 of 18 answers to "buy another line, or fix this one?", citing the "Kestrel vs new equipment" page and the benchmark's coverage.
Finance director · trigger: 0 to 2. The benchmark is being quoted.
The mining mix-up: gone from every answer, as being named predicted, within three scans.
Plant manager · framing: still 0. Ray Hollins's floor-day post went out on 19 September; we don't expect it in the Score before Q1. Two plant managers in live deals have mentioned it already.
4. Campaigns
Campaign
Judged by (from its brief)
Result
Decision
The annual benchmark (May)
Coverage in the three cited trade titles; quoted by assistants on framing questions
Covered by 2 of 3 titles; quoted in 2 of the 7 framing questions
Repeat next May; pitch the third title earlier
"Before you buy another line" (Aug–Sep)
Name searches and fit calls, ad areas against holdout; fit calls mentioning equipment; outbound replies
Name searches up about 30% in ad areas, about 8% in holdout areas; 5 fit calls mentioning equipment against 1; 3 replies from 14 letters. Small numbers: a sketch, not proof
Repeat next year, in the second year's form, once Hartwell's results are confirmed
Retargeting holdout
Any difference, on against off
None measurable
Stays off
5. Changes to the map
New question, held: four owners replying to outbound letters asked whether a government grant could pay for a review. Added as a hypothesis to owner · options: "Can a grant pay for it?" Held until three interviews confirm it.
New alternative: for the ramp-up question, two assistants named a large firm's "lean in 90 days" programme. Added to the alternatives; the comparison page goes on wave 3's list.
Dropped from the levers: procurement's pack. It's worth 0.3 at most, and nobody in a deal has asked for it. Recorded, not continued.
6. Q4's three fixes
Fix
Owner
Moments
Predicted
Shows by
The board paper, used in every live deal during board season
The pitch
Finance director building the case
+0.8 (0.3 to 1.3)
End Q4
A food and drink sector case on the website and the fact sheet
Being named
Comparing, food and drink
+0.6 (0.2 to 1.0)
End Q4 or Q1
The owners' page, and the first round table
Events
Owner options and checking
+0.5 (0.1 to 1.0)
Q1
What to notice. Every fix had a prediction before it started, and the note puts the measured result beside it, including the one that fell short and why. The total is read with its range, and the review says when the range first cleared the old score. The campaign results are called a sketch where the numbers are small. The map gained a question and an alternative from the builds' own findings, and lost a lever that wasn't worth its effort. And the next quarter's three fixes are chosen from the new loss split, each with a range and a date it should show.
Templates
1. The quarterly review agenda (half a day; papers out a week before)
1. The Score: total and range, against the last four quarters; the loss split by stage.
2. Last quarter's three fixes: predicted against measured, with a verdict each.
3. Moments that moved, or should have and didn't.
4. Each build's Loop table: one line per build, from its owner.
5. Campaigns: each brief's "judged by", with results.
6. Changes to the map: new moments, questions, alternatives; moments moved between
tiers.
7. Next quarter's three fixes: moments, stage, predicted range, owner, date it ships, when
it should show.
2. The fix log (one row per fix, kept for ever)
Quarter
Fix
Owner
Moments
Stage
Predicted (range)
Shipped on
Measured
Verdict
What we learned
3. The map change log
Date
Change
Source
Evidence
Status (hypothesis / confirmed)
Effect on the sample
4. The new-client question (asked at every first meeting, and logged)
"What was happening when you first thought of talking to someone about this?" "Where had you come across Kestrel before you got in touch?" (Offer: a search, an AI assistant, a colleague or client, LinkedIn or YouTube, an event, a letter, an ad, somewhere else.)
Running it
Who owns what. One person owns the Score and the list of fixes, across marketing and sales, with the standing to say no to work that moves no moment. At Kestrel it's the managing partner. They don't own the builds; they decide which fix goes first and which build does it. Each build owner brings their Loop table to the review. Being named's owner runs the monthly scan. The marketing lead keeps the fix log and the map change log.
When
What happens
Monthly
The scan; corrections; new clients' answers logged
Week 1 of each quarter
The rescore, on the unchanged sample
Week 2
Papers out: the Score, the loss split, each build's Loop line, each campaign's results
Week 3
The review: half a day, every build owner; the next three fixes chosen and predicted
Weeks 3 to 12
The fixes ship, on the dates their owners gave
December
The yearly reset: the map refreshed, the sample reviewed, weights checked against the deal record, next year's campaign calendar
Three fixes, not ten. A quarter with ten fixes can't tell which one worked. Three, each with a prediction, can.
Common mistakes
The mistake
What it breaks
The bias it ignores
What it looks like
Instead
Measuring and stopping
The whole loop
Good enough beats best
A dashboard everyone looks at and nobody acts on
Every review ends with three fixes, predicted
Changing the questions mid-year
The comparison
Familiar feels safe
"The new questions are better", and the trend vanishes
Change the sample once a year, and record it
Reading the total, not the range
The decision
Feeling first, reasons after
Celebrating 18 to 21
Read the range; read the moments
No prediction
The learning
Losses loom larger
Fixes chosen, results "interesting"
A range written down before the fix starts
Ten fixes at once
The attribution
A hard choice stalls
Everything changed; nobody knows what worked
Three a quarter
Crediting the fix for everything
The truth
We follow others
A launch and a fix in the same quarter, one credited
Note what else changed before crediting anything
More content as the answer to every gap
The diagnosis
Good enough beats best
A disappointing score, so more blog posts
Find the stage and the cause first
Keeping a fix that did nothing
The budget
Losses loom larger
"We've put so much into it"
Drop it, and record why
The bias to watch in the team: the sunk cost fallacy. The more a team has put into a fix, the harder it is to drop when the rescore says it did nothing. The fix log exists so that dropping a fix is a recorded decision, not an admission.
What the Loop can't tell you
The Score looks forwards, at the choice. The measures a finance director already trusts (attribution, marketing mix models and experiments) look backwards, at sales. The Loop uses both: the Score says which fix to try, and an experiment such as Advertising's regional holdout says whether it paid.
Be clear about the limits:
The weights are judgement. The mode weights and the moment weights need calibrating against real sales, mode by mode. The yearly reset checks them against the deal record, and that's a start, not a proof.
Nobody has yet shown that the Score moves with market share. Until that's tested, read it as an index of your odds, not a forecast of sales.
Some numbers aren't independent. Found and Preferred come from the same sample of answers, so the real margin is wider than the arithmetic says.
It can't see a sale. Only your own data can. Where you have it, it outranks everything above.
And one measure costs nothing: ask every new client how they found you, and include "an AI assistant" as an answer. Over a year, those answers will tell Kestrel more about which moments matter than any model.
Shapes by business type
Business type
Typical mode
How the Loop usually runs
B2B professional services
Committee or owner-led
Quarterly reviews; a slow total and faster moments; the deal record read deal by deal, because there are few of them
B2B software
Committee
Quarterly reviews, with product usage and pipeline data beside the Score; holdouts and, with enough years, a mix model
Considered consumer (finance, health, education)
Considered personal
Quarterly, timed around the seasons that start the search; the new-customer question matters most
Ecommerce
Quick choice or habitual
Monthly on the moments, quarterly on the total; sales data and holdouts carry more weight than for slower categories
Local services
Owner-led or considered personal
Five moments by hand each quarter, using the book's self-score worksheet; an afternoon to a day
Marketplaces
Varies on each side
A loop for each side, read together: a fix on one side often shows on the other
Feeling a bit overwhelmed?
You should be, a little. One firm: 1,818 answers a month from the machines, 114 searches and 40 places, the deal record read moment by moment, a loss split by stage, levers re-ranked every quarter, three fixes predicted and recorded, every build's Loop table and every campaign's measures, a map that changes as the evidence comes in, and a yearly reset. Most firms look at a dashboard, feel good or bad about it, and make more content.
RocMode does part of the heavy lifting:
The measuring, the same way each time. RocMode asks your buyers' questions, without your name in them, of several AI assistants, several times each, and records who's named, which rivals appear and which sources are cited. Questions that name your brand don't count towards being found.
A range, not just a number. Each moment's score comes with its range, so you can tell a real move from noise.
What kind of moment, and the biggest lever. Each moment is sorted into won, hidden, borrowed or empty, and RocMode names the fix worth the most points, with the points it should add.
Writing down predictions, choosing the three fixes and running the review are still yours.